

The Complete Stochastic RSI Trading Strategy Guide: Master Advanced Settings & Divergence Patterns for 2025
Master the Stochastic RSI like a professional trader with advanced settings most people never learn about. Discover the 5-3-3 configuration for day trading precision, the 21-14-14 setup for swing trading accuracy, and powerful divergence patterns that can transform your momentum analysis. Learn to avoid the two critical mistakes that destroy trading accounts and implement automatic divergence detection for forex, crypto, and stock markets.

The Ultimate Guide to the RSI Indicator: Mastering RSI Trading Strategies and Settings 2025
The Relative Strength Index (RSI) is a powerful momentum indicator used to identify overbought and oversold conditions, trend strength, and potential reversals. This ultimate guide covers how RSI works, key trading strategies, advanced settings, and how to combine it with other indicators for better accuracy. Whether you're trading stocks, Forex, or crypto, mastering RSI can help you make more informed trading decisions.
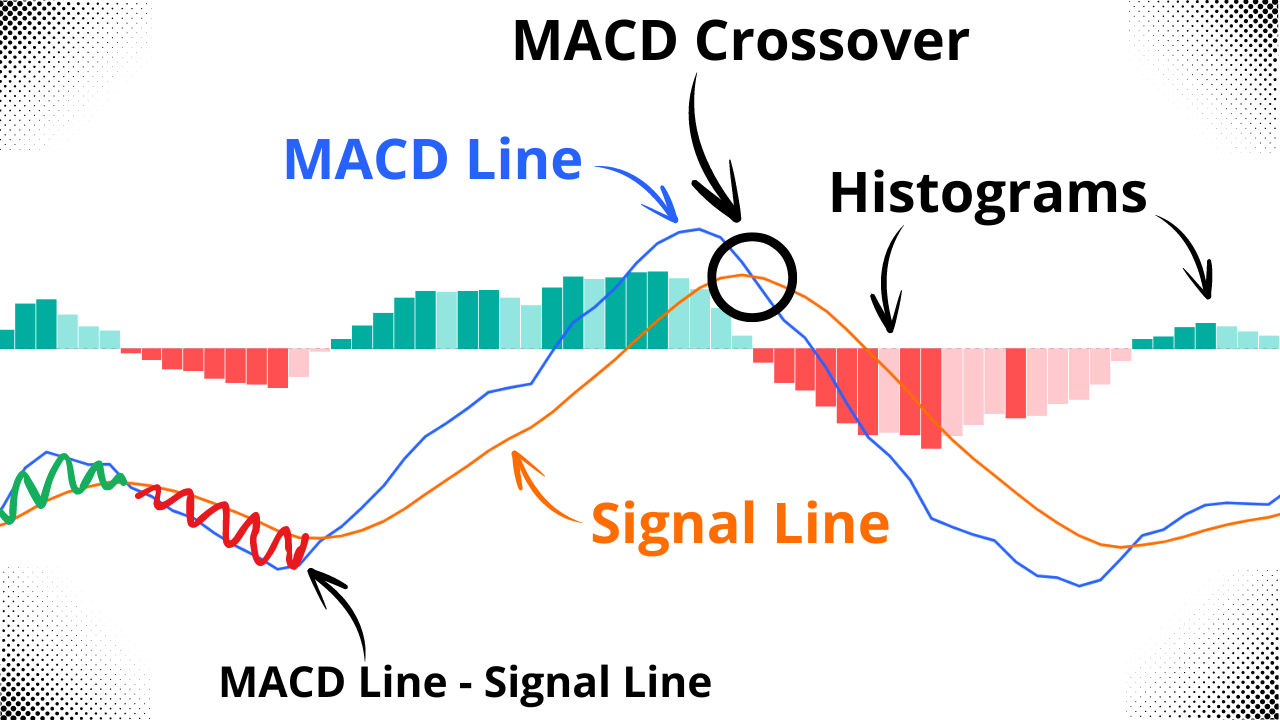
Understanding the MACD Indicator: MACD Line, Signal Line, Histogram, Crossover and Zero Line
What is MACD? If you've been trading for a while, you've likely come across the MACD indicator. While it might seem complex at first glance, the MACD is actually straightforward and highly effective. In this article, you'll learn how the MACD indicator works, and its key components: the MACD line, signal line, histogram, and zero line.